
Randolph, Massachusetts
Randolph, Massachusetts | |
|---|---|
City | |
 Randolph Town Hall | |
 Seal | |
| Motto(s): Latin: Fari Quae Sentiat "To Say What One Feels" | |
 Location in Norfolk County in Massachusetts | |
| Coordinates: 42°09′45″N 71°02′30″W / 42.16250°N 71.04167°W | |
| Country | |
| State | |
| County | Norfolk |
| Settled | 1710 |
| Incorporated | 1793 (T) 2010 (C) |
| Government | |
| • Type | Council-manager |
| • Council president | William Alexopoulos |
| • City manager | Brian P. Howard |
| Area | |
• Total | 10.5 sq mi (27.2 km2) |
| • Land | 10.1 sq mi (26.1 km2) |
| • Water | 0.4 sq mi (1.1 km2) |
| Elevation | 184 ft (56 m) |
| Population (2020)[1] | |
• Total | 34,984 |
| • Density | 3,300/sq mi (1,300/km2) |
| Time zone | UTC−5 (Eastern) |
| • Summer (DST) | UTC−4 (Eastern) |
| ZIP Code | 02368 |
| Area code | 781/339 |
| FIPS code | 25-55955 |
| GNIS feature ID | 0618328 |
| Website | www |
| Randolph charter of 2009[2] | |
Randolph is a suburban city in Norfolk County, Massachusetts, United States. At the 2020 census, the city population was 34,984.[3] Randolph adopted a charter effective January 2010 providing for a council-manager form of government instead of the traditional town meeting. Randolph is one of thirteen Massachusetts municipalities that have applied for, and been granted, city forms of government but wish to retain "The town of" in their official names.[4]
History
[edit]
It was called Cochaticquom by the local Cochato tribes. The town was incorporated in 1793 from what was formerly the south precinct of the town of Braintree. According to the centennial address delivered by John V. Beal, the town was named after Peyton Randolph, first president of the Continental Congress.[5]
Randolph was formerly the home of several large shoe companies. Many popular styles were made exclusively in Randolph, including the "Randies". At the time of Randolph's incorporation in 1793, local farmers were making shoes and boots to augment household incomes from subsistence farming. In the next half century, this sideline had become the town's major industry, attracting workers from across New England, Canada and Ireland and later from Italy and Eastern Europe, each adding to the quality of life in the town. By 1850, Randolph had become one of the nation's leading boot producers, shipping boots as far away as California and Australia.
The decline of the shoe industry at the beginning of the twentieth century led to Randolph's evolution as a suburban residential community. Boot and shoe making has been supplanted by light manufacturing and service industries. The town's proximity to major transportation networks has resulted in an influx of families from Boston and other localities who live in Randolph but work throughout the metropolitan area.
Starting in the 1950s, Randolph saw significant growth in its Jewish community with the exodus of Jews from Boston's Dorchester and Mattapan neighborhoods. In 1950, fifteen or twenty Jewish families lived in the town; by 1970, Randolph had about 7,000 Jewish residents, and about 9,000 in 1980, the largest such community south of Boston. At its peak, Randolph had a kosher butcher, Judaica shop, kosher bakery, and two synagogues. By the early 1990s, the population shrank to about 6,000.[6][7]
The inspiration for the nationally observed Great American Smokeout came from a Randolph High School guidance councilor, who observed in a 1969 discussion with students that he could send all of them to college if he had a nickel for every cigarette butt he found on the ground. This touched off an effort by the Randolph High School class of 1970, supported by the Randolph Rotary Club, to have local smokers give it up for a day and put the savings toward a college scholarship fund. The event went national in 1977.[8]
Geography
[edit]According to the United States Census Bureau, the town has a total area of 10.5 square miles (27.2 km2), of which 10.1 square miles (26.1 km2) is land and 0.4 square mile (1.1 km2) (4.10%) is water. It is drained by the Cochato River and Blue Hill River, which flow into the Neponset River.
| Month | Jan | Feb | Mar | Apr | May | Jun | Jul | Aug | Sep | Oct | Nov | Dec | Year |
|---|---|---|---|---|---|---|---|---|---|---|---|---|---|
| Record high °F (°C) | 68 (20) |
71 (22) |
89 (32) |
94 (34) |
96 (36) |
99 (37) |
100 (38) |
101 (38) |
99 (37) |
88 (31) |
81 (27) |
74 (23) |
101 (38) |
| Mean maximum °F (°C) | 56.6 (13.7) |
56.9 (13.8) |
65.6 (18.7) |
79.4 (26.3) |
87.3 (30.7) |
90.0 (32.2) |
92.9 (33.8) |
91.3 (32.9) |
86.9 (30.5) |
77.6 (25.3) |
68.4 (20.2) |
60.0 (15.6) |
94.7 (34.8) |
| Mean daily maximum °F (°C) | 34.7 (1.5) |
37.0 (2.8) |
44.1 (6.7) |
56.3 (13.5) |
66.8 (19.3) |
75.4 (24.1) |
81.7 (27.6) |
80.2 (26.8) |
72.7 (22.6) |
61.0 (16.1) |
50.1 (10.1) |
40.2 (4.6) |
58.4 (14.6) |
| Daily mean °F (°C) | 26.5 (−3.1) |
28.2 (−2.1) |
35.5 (1.9) |
47.1 (8.4) |
58.5 (14.7) |
66.5 (19.2) |
72.7 (22.6) |
71.4 (21.9) |
64.2 (17.9) |
52.5 (11.4) |
42.0 (5.6) |
32.5 (0.3) |
49.8 (9.9) |
| Mean daily minimum °F (°C) | 18.3 (−7.6) |
19.5 (−6.9) |
26.9 (−2.8) |
37.9 (3.3) |
48.2 (9.0) |
57.6 (14.2) |
63.8 (17.7) |
62.6 (17.0) |
55.6 (13.1) |
44.0 (6.7) |
33.8 (1.0) |
24.9 (−3.9) |
41.1 (5.1) |
| Mean minimum °F (°C) | 0.0 (−17.8) |
3.1 (−16.1) |
10.1 (−12.2) |
26.7 (−2.9) |
37.5 (3.1) |
45.9 (7.7) |
54.9 (12.7) |
53.4 (11.9) |
42.3 (5.7) |
30.5 (−0.8) |
19.6 (−6.9) |
8.7 (−12.9) |
−2.5 (−19.2) |
| Record low °F (°C) | −14 (−26) |
−21 (−29) |
−5 (−21) |
6 (−14) |
27 (−3) |
36 (2) |
44 (7) |
39 (4) |
28 (−2) |
21 (−6) |
5 (−15) |
−19 (−28) |
−21 (−29) |
| Average precipitation inches (mm) | 4.50 (114) |
4.00 (102) |
5.52 (140) |
4.76 (121) |
3.82 (97) |
4.63 (118) |
3.47 (88) |
3.91 (99) |
4.06 (103) |
5.49 (139) |
4.31 (109) |
5.39 (137) |
53.86 (1,367) |
| Average snowfall inches (cm) | 18.6 (47) |
18.2 (46) |
15.0 (38) |
2.8 (7.1) |
0.0 (0.0) |
0.0 (0.0) |
0.0 (0.0) |
0.0 (0.0) |
0.0 (0.0) |
0.7 (1.8) |
1.8 (4.6) |
12.6 (32) |
69.7 (176.5) |
| Average extreme snow depth inches (cm) | 10.6 (27) |
11.5 (29) |
9.8 (25) |
2.6 (6.6) |
0.0 (0.0) |
0.0 (0.0) |
0.0 (0.0) |
0.0 (0.0) |
0.0 (0.0) |
0.3 (0.76) |
1.3 (3.3) |
7.7 (20) |
17.1 (43) |
| Average precipitation days (≥ 0.01 in) | 13.2 | 11.3 | 12.5 | 12.5 | 13.0 | 12.1 | 10.5 | 10.2 | 9.2 | 11.5 | 10.9 | 12.6 | 139.5 |
| Average snowy days (≥ 0.1 in) | 8.1 | 7.1 | 5.7 | 1.3 | 0.0 | 0.0 | 0.0 | 0.0 | 0.0 | 0.4 | 1.3 | 5.3 | 29.2 |
| Mean monthly sunshine hours | 132.1 | 146.7 | 174.0 | 185.6 | 220.2 | 231.8 | 258.1 | 242.5 | 204.1 | 182.1 | 133.3 | 125.9 | 2,236.4 |
| Percentage possible sunshine | 46.3 | 50.9 | 48.5 | 47.9 | 50.4 | 52.7 | 58.0 | 58.7 | 56.7 | 55.1 | 47.0 | 45.9 | 51.5 |
| Source 1: NOAA[9][10] | |||||||||||||
| Source 2: BHO[11] | |||||||||||||
Demographics
[edit]| Year | Pop. | ±% |
|---|---|---|
| 1850 | 4,741 | — |
| 1860 | 5,760 | +21.5% |
| 1870 | 5,642 | −2.0% |
| 1880 | 4,027 | −28.6% |
| 1890 | 3,946 | −2.0% |
| 1900 | 3,998 | +1.3% |
| 1910 | 4,301 | +7.6% |
| 1920 | 4,756 | +10.6% |
| 1930 | 6,553 | +37.8% |
| 1940 | 7,634 | +16.5% |
| 1950 | 9,982 | +30.8% |
| 1960 | 18,900 | +89.3% |
| 1970 | 27,035 | +43.0% |
| 1980 | 28,218 | +4.4% |
| 1990 | 30,093 | +6.6% |
| 2000 | 30,963 | +2.9% |
| 2010 | 32,112 | +3.7% |
| 2020 | 34,984 | +8.9% |
| 2022* | 34,530 | −1.3% |
| * = population estimate. Source: United States census records and Population Estimates Program data.[12][13][14][15][16][17][18][19][20][21][22] | ||
As of the census[23] of 2010, there were 32,158 people, 11,564 households, and 8,038 families residing in the city. The population density was 3,184 inhabitants per square mile (1,229/km2). There were 11,564 housing units at an average density of 1,145.4 per square mile (442.2/km2). The racial makeup of the city was 41.6% White, 38.3% Black or African American, 0.3% Native American, 12.4% Asian (6.3% Vietnamese, 3.3% Chinese, 0.9% Filipino, 0.8% Asian Indian) 0.0% Pacific Islander, 3.7% from other races, and 3.5% from two or more races. Hispanic or Latino of any race were 6.4% of the population.
Randolph is one of the fastest growing minority-municipalities in the United States. 60% of all students attending Randolph elementary schools are of African descent (black), 21% Latino descent, predominately Dominican, 11% Caucasian descent (white), and 8% East Asian descent.
There were 11,564 households, out of which 29.4% had children under the age of 18 living with them, 46.7% were married couples living together, 17.4% had a female householder with no husband present, and 30.5% were non-families. 24.5% of all households were made up of individuals, and 9.6% had someone living alone who was 65 years of age or older. The average household size was 2.75 and the average family size was 3.31.
In the town, the population was spread out, with 21.7% under the age of 18, 8.7% from 18 to 24, 26.5% from 25 to 44, 29.4% from 45 to 64, and 13.4% who were 65 years of age or older. The median age was 38 years. For every 100 females, there were 91.7 males. For every 100 females age 18 and over, there were 88.0 males.
The median income for a household in the town was $55,255, and the median income for a family was $61,942. Males had a median income of $41,719 versus $32,500 for females. The per capita income for the town was $23,413. About 5.5% of families and 6.5% of the population were below the poverty line, including 4.5% of those under age 18 and 5.0% of those age 65 or over.
Arts and culture
[edit]Library
[edit]The Turner Free Library serves as the town's public library and is part of the regional Old Colony Library Network.[24] The library was founded in 1874 in honor of the Turner family,[25] who donated the library building, land, and a fund of $10,000 to the Town of Randolph on the condition that the Town maintain a free public library on the site.[26] The Turner Free Library was opened in 1875.[27]
Registered historic places
[edit]
Sites in Randolph listed on the National Register of Historic Places include:
- Jonathan Belcher House, built in 1806.
- Stetson Hall, built in 1842.
- Ponkapoag Camp of Appalachian Mountain Club.
- Gills Farm Archaeological District.
Government
[edit]Randolph was originally governed by an open town meeting form of government. In an annual town meeting held on March 11, 1947, attendees voted unanimously to adopt a representative town meeting form of government.[28] Under the representative town meeting, the town would be divided into four precincts that would elect 60 town meeting members each.[29] The new form of government went into effect March 7, 1949.[30]
In a special election on April 7, 2009, the town adopted a new charter that became effective in January 2010, changing the town's form of government to a council-manager system.[2][31]
The District Councilor/President is Christos Alexopoulos[32][33]
| Registered Voters and Party Enrollment as of February 1, 2023[34] | |||||
|---|---|---|---|---|---|
| Party | Number of Voters | Percentage | |||
| Democratic | 10,146 | 44.33% | |||
| Republican | 1,014 | 4.43% | |||
| Unaffiliated | 11,555 | 50.49% | |||
| Libertarian | 50 | 0.22% | |||
| Total | 22,885 | 100% | |||
Education
[edit]Education is administered by Randolph Public School District. Schools include:[35]
- AIM Academy
- John F. Kennedy Elementary School
- Margaret L. Donovan Elementary School
- Martin E. Young Elementary School
- North Randolph Elementary School
- Randolph Community Middle School
- Randolph High School
Infrastructure
[edit]Transportation
[edit]Major highways
[edit]- Interstate 93
- U.S. Route 1
- Massachusetts Route 24 (Fall River Expressway)
- Massachusetts Route 28
- Massachusetts Route 139
Rail
[edit]Holbrook/Randolph station is served by the Fall River/New Bedford Line of the MBTA Commuter Rail.
Bus
[edit]Bus service is provided by Massachusetts Bay Transportation Authority and Brockton Area Transit Authority.
Airport
[edit]Notable people
[edit]This section needs additional citations for verification. (February 2024) |
- Ebenezer Alden, physician, biographer, bibliophile
- Rich Amiri, rapper
- Audie Cornish, journalist
- Danny Davis, bandleader and producer
- Mary E. Wilkins Freeman, author
- Bill Kenney, football coach
- Rod Langway, Hall of Fame hockey player
- Robert C. Long, National League Baseball Umpire.
- Gene McAuliffe, baseball player
- Shabazz Napier, NBA player for the Washington Wizards
- Jordan Rich, radio talk show host
- William Rimmer, painter & sculptor
- Mark Snyder, radio host, newspaper columnist & social media new site publisher
- Clinton Sparks, Grammy nominated music producer & hip hop DJ
- Scott D. Tingle, NASA astronaut
- Touré (né Touré Neblett), writer, music journalist, cultural critic, and television personality
Notes
[edit]References
[edit]- ^ "Population and Housing Occupancy Status: 2010 - State -- County Subdivision, 2010 Census Redistricting Data (Public Law 94-171) Summary File". U.S. Census Bureau. Retrieved June 26, 2011.[dead link]
- ^ a b "Chapter 2 of the Acts of 2009". Boston: Massachusetts General Court. Retrieved January 26, 2010.
- ^ "Census - Geography Profile: Randolph town, Norfolk County, Massachusetts". Retrieved September 29, 2021.
- ^ "Massachusetts City and Town Incorporation and Settlement Dates". Secretary of the Commonwealth of Massachusetts. April 7, 2023.
- ^ Beal, John V. (July 1893). "An Address in Commemoration of the One Hundredth Anniversary of the Incorporation of Randolph, Massachusetts". Archived from the original on August 11, 2014.
- ^ Sarna, Jonathan D. (2005). The Jews of Boston, pp.167-168. Yale University Press. ISBN 978-0-300-10787-6.
- ^ Israel, Sherry (1985). 1985 CJP Demographic Study Archived 2011-07-22 at the Wayback Machine. Combined Jewish Philanthropies of Greater Boston.
- ^ "All About the Event". cancer.org. Archived from the original on November 18, 2006 – via Wayback Machine.
- ^ "NOAA Online Weather Data – NWS Boston". National Weather Service. Retrieved October 31, 2024.
- ^ "U.S. Climate Normals Quick Access – Station: Blue Hill COOP, MA". National Oceanic and Atmospheric Administration. Retrieved February 10, 2023.
- ^ "Blue Hill Observatory daily sunshine data". Blue Hill Meteorological Observatory. Retrieved October 11, 2015.
- ^ "Total Population (P1), 2010 Census Summary File 1". American FactFinder, All County Subdivisions within Massachusetts. United States Census Bureau. 2010.
- ^ "Massachusetts by Place and County Subdivision - GCT-T1. Population Estimates". United States Census Bureau. Retrieved July 12, 2011.
- ^ "1990 Census of Population, General Population Characteristics: Massachusetts" (PDF). US Census Bureau. December 1990. Table 76: General Characteristics of Persons, Households, and Families: 1990. 1990 CP-1-23. Retrieved July 12, 2011.
- ^ "1980 Census of the Population, Number of Inhabitants: Massachusetts" (PDF). US Census Bureau. December 1981. Table 4. Populations of County Subdivisions: 1960 to 1980. PC80-1-A23. Retrieved July 12, 2011.
- ^ "1950 Census of Population" (PDF). Bureau of the Census. 1952. Section 6, Pages 21-10 and 21-11, Massachusetts Table 6. Population of Counties by Minor Civil Divisions: 1930 to 1950. Retrieved July 12, 2011.
- ^ "1920 Census of Population" (PDF). Bureau of the Census. Number of Inhabitants, by Counties and Minor Civil Divisions. Pages 21-5 through 21-7. Massachusetts Table 2. Population of Counties by Minor Civil Divisions: 1920, 1910, and 1920. Retrieved July 12, 2011.
- ^ "1890 Census of the Population" (PDF). Department of the Interior, Census Office. Pages 179 through 182. Massachusetts Table 5. Population of States and Territories by Minor Civil Divisions: 1880 and 1890. Retrieved July 12, 2011.
- ^ "1870 Census of the Population" (PDF). Department of the Interior, Census Office. 1872. Pages 217 through 220. Table IX. Population of Minor Civil Divisions, &c. Massachusetts. Retrieved July 12, 2011.
- ^ "1860 Census" (PDF). Department of the Interior, Census Office. 1864. Pages 220 through 226. State of Massachusetts Table No. 3. Populations of Cities, Towns, &c. Retrieved July 12, 2011.
- ^ "1850 Census" (PDF). Department of the Interior, Census Office. 1854. Pages 338 through 393. Populations of Cities, Towns, &c. Retrieved July 12, 2011.
- ^ "City and Town Population Totals: 2020−2022". United States Census Bureau. Retrieved November 24, 2023.
- ^ "U.S. Census website". United States Census Bureau. Retrieved January 31, 2008.
- ^ "Library". Town of Randolph. Retrieved March 7, 2025.
- ^ "The Turner Library Randolph Massachusetts 1875-1975 (1975)". Board of Trustees, Turner Free Library. Retrieved March 7, 2025.
- ^ "The Selectmen of the Town of Randolph Present the Following as Their Report on the Free Public Library Including the Correspondence and Copy of the Deed Conveying the Same to the Town (Apr. 1875)". Selectmen, Town of Randolph. Retrieved March 7, 2025.
- ^ "Order of Exercises on the Occasion of the Dedication of the Free Public Library Building (Apr. 22, 1875)". Retrieved March 7, 2025.
- ^ Town of Randolph (1947). Annual Report. Town Officers and Committees. p. 21. Retrieved April 17, 2023.
- ^ Town of Randolph (1948). Annual Report. Town Officers and Committees. p. 7. Retrieved April 17, 2023.
- ^ Town of Randolph (1949). Annual Report. Town Officers and Committees. pp. 9–20. Retrieved April 17, 2023.
- ^ "Randolph council election set for Sept. 15". The Patriot Ledger. April 28, 2009. Retrieved January 26, 2010.
- ^ Town of Randolph (January 8, 2018). "Meeting Minutes - Final". randolph-ma.gov. Retrieved April 17, 2023.
- ^ Town of Randolph (January 6, 2025). "Meeting Minutes - page 1" (PDF). Retrieved January 28, 2025.
- ^ "Registered Voters and Party Enrollment as of February 1, 2023" (PDF). Massachusetts Elections Division. Retrieved April 17, 2023.
- ^ "Schools". Randolph Public School District. Retrieved April 30, 2025.
External links
[edit]Municipalities and communities of Norfolk County, Massachusetts, United States | ||
|---|---|---|
| Cities | 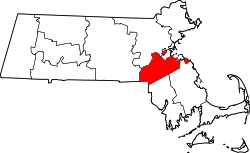 | |
| Towns | ||
| CDPs | ||
| Other villages | ||
| Footnotes | ‡This populated place also has portions in an adjacent county or counties | |
Boston (capital) | |
| Topics | |
| Society | |
| Regions | |
| Counties | |
| Cities |
|
| International | |
|---|---|
| National | |
| Geographic | |